
Stock Investment AI
A comprehensive educational and paper-trading platform designed to demystify the stock market through real-time AI integration.
An interactive learning environment that pairs live OHLCV market data with on-demand generative-AI explanations. Beginners drop into a tutoring layer; experienced users get a paper-trading sandbox, a rule-based strategy builder, and a structured reader for market literacy, all in one dashboard.
The brief.
Over 60% of American adults are invested in the stock market, yet a significant disparity exists between participation and proficiency. A vast majority of individual traders fail to beat the 10% annualized returns offered by passive benchmarks like the S&P 500. The barriers to trading have collapsed, but the barriers to financial literacy and strategic execution remain formidably high.
There is also a large disconnect between how institutional players function and what ordinary people know about the stock market. Cultural flashpoints like meme stocks, The Big Short, and public perceptions of figures like Warren Buffett or Nancy Pelosi sensationalize the activity rather than teach it. The team aims to move users beyond vibe-based investing toward a high-fidelity sandbox where passive observers can transition into informed strategists.
Target: Newer traders — people just starting to learn the market, recent entrants to the workforce, and younger investors looking for a vertically integrated training ground that combines learning, analysis, and simulated execution in one place.
By integrating real-time market data with on-demand Generative AI explanations, we allow users to deconstruct complex technical indicators and market movements as they occur.From the write-up
The landscape.
| Tool | Approach | Weakness | Our edge |
|---|---|---|---|
| Investopedia | Editorial articles + paper-trading game | Mixes educational content with ads and news; paper-trading game fails to account for order liquidity | Tutorials kept separate from ads and news; paper-trading runs on Alpaca |
| Schwab / Robinhood explainers | Embedded learn-pages on broker sites | Hidden away on the broker site, creating cognitive separation between learning and playing the market | Explanations sit alongside the live chart instead of behind a separate broker page |
| Composer / NinjaTrader | Professional strategy builders | High cost and complicated tools aimed at professional traders | No sign-up, no fee, fast iteration loop on rule-based strategies |
The core differentiator is embedding generative AI directly into the interface. Clicking any on-screen element produces an immediate, context-aware explanation, turning a static dashboard into an active learning environment and turning learning the stock market into something fun.
The system.
The platform is a browser-based dashboard with five user-facing areas: a home screen, an interactive charting workspace, a paper-trading workspace, a strategy builder, and an educational reader. The goal is to keep learning, market observation, strategy testing, and simulated execution in one interface so users can move from understanding a concept to testing it against real market data without switching tools.
Navigation is tabbed: Home, Charts, Paper, Strategy, and Reader, plus light/dark theme control and a lightweight login form. Each tab acts as a focused tool while shared styling variables and API utilities keep the experience consistent across the platform.
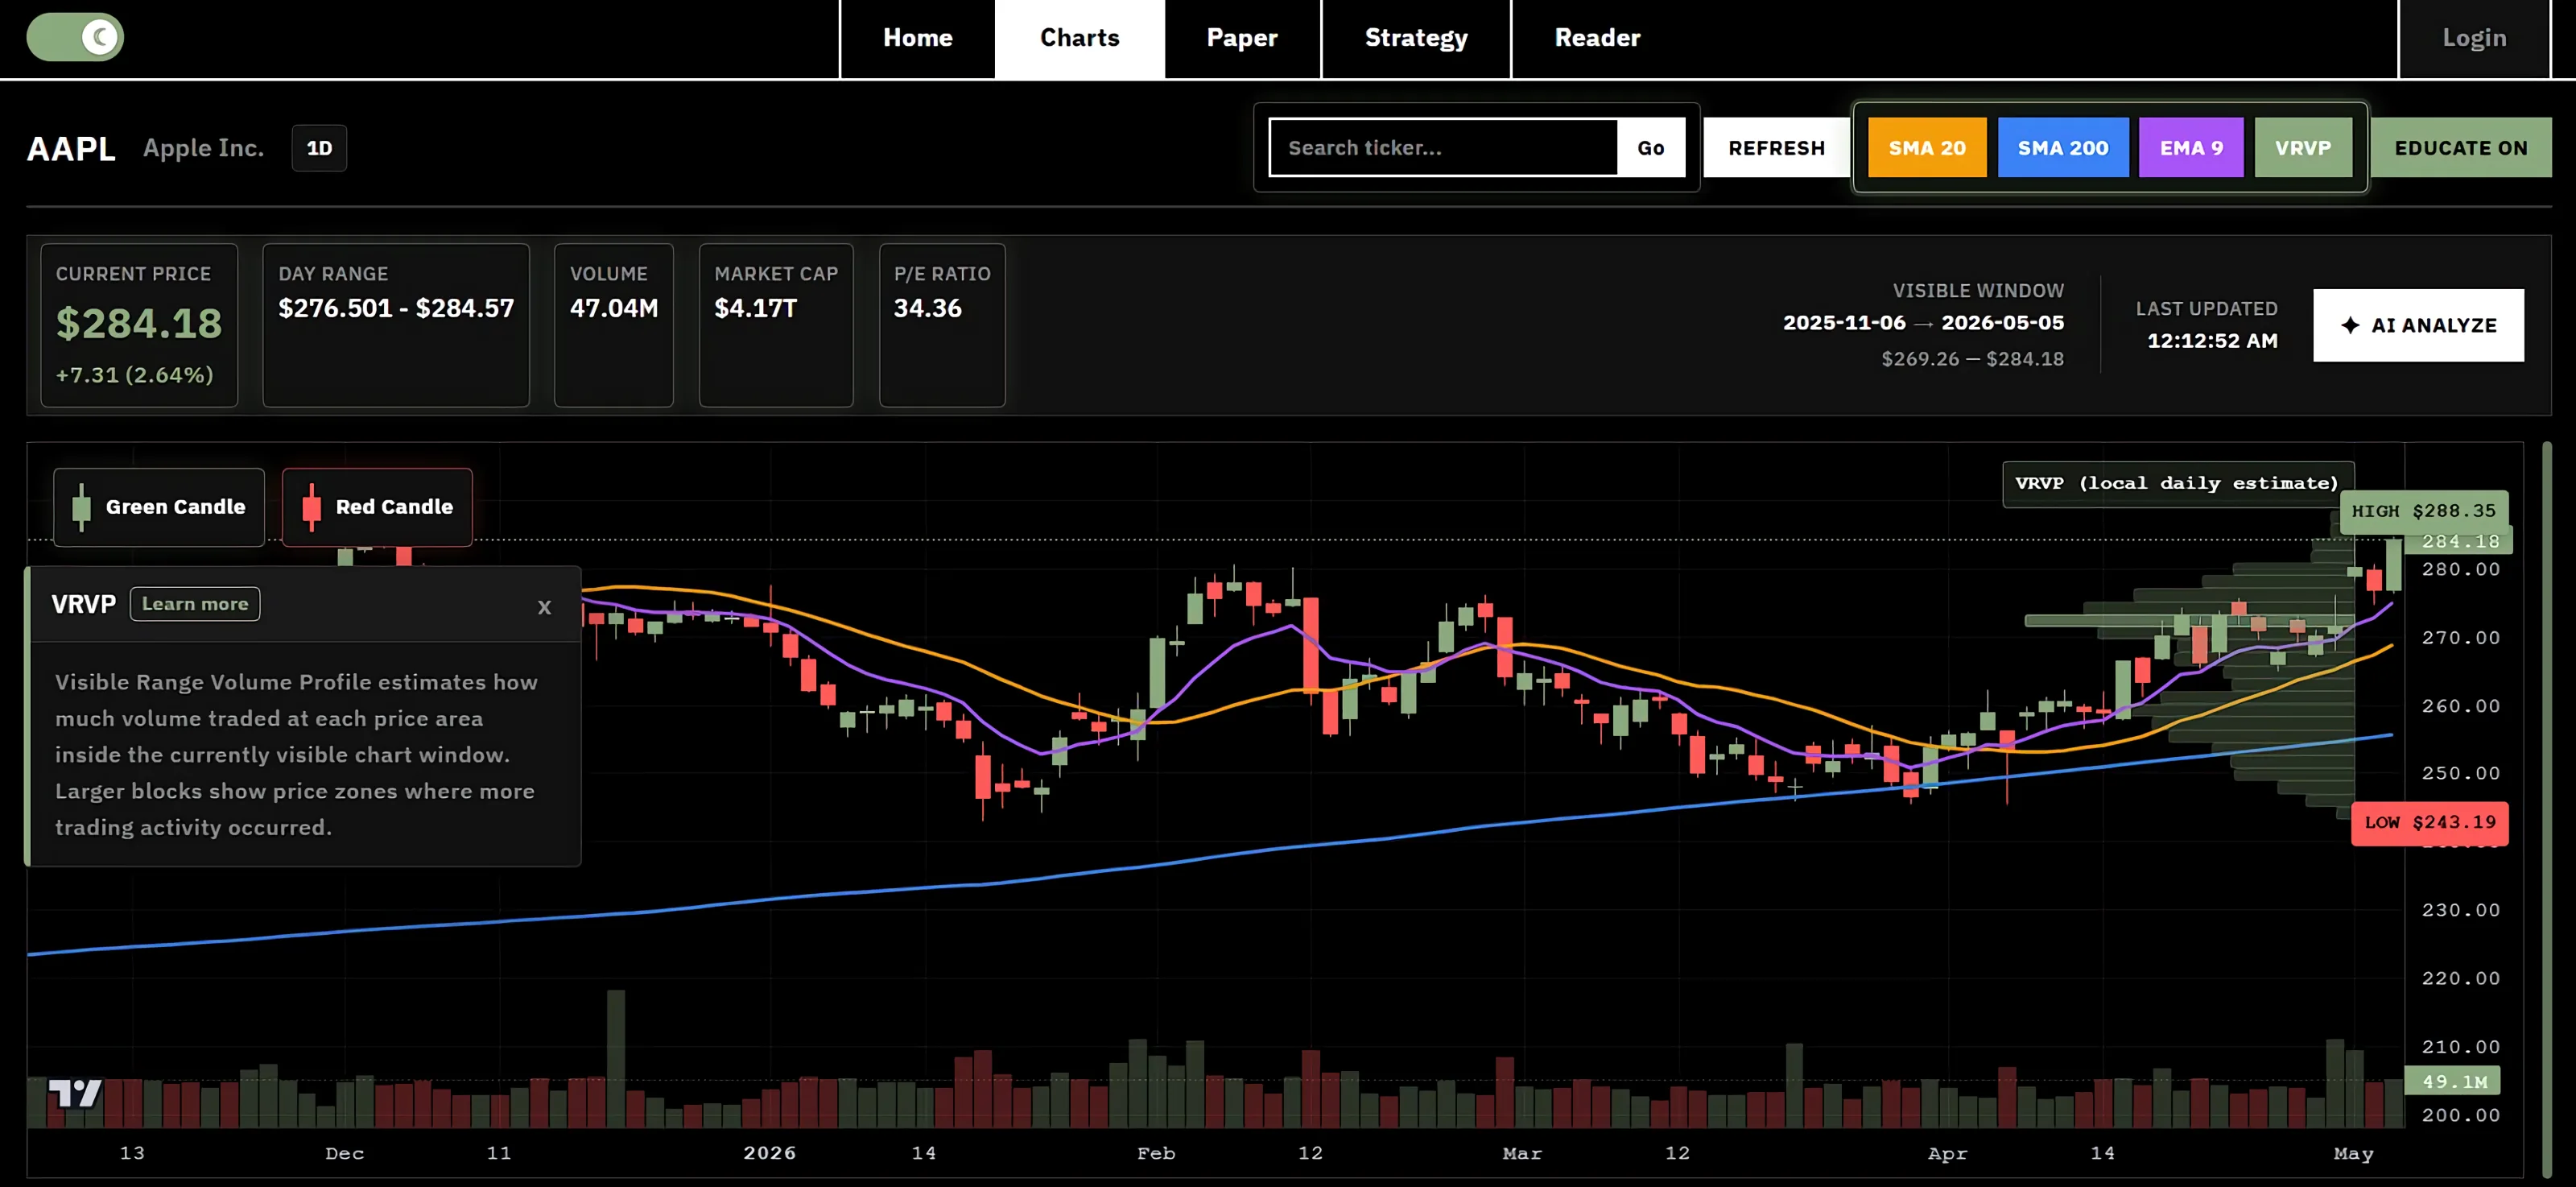
The Charts tab is the core market-analysis workspace. It uses lightweight-charts to render a TradingView-style candlestick view with volume bars, crosshair interaction, stock search, dynamic history loading, and periodic background refreshes. A central feature is AI-assisted technical analysis: clicking AI Analyze captures only the currently visible chart window, the backend computes summary metrics (start/end price, percent change, period high/low, volatility, average volume), and the data is passed to an OpenRouter-hosted LLM. This keeps the LLM grounded in the same data the user is seeing, rather than asking it to analyze an ambiguous ticker symbol in isolation.
The implementation.
The system follows a clear frontend-backend split. The React/Vite frontend owns the user interface, chart rendering, tab state, theme state, and client-side interaction. A FastAPI backend acts as the integration layer for market data, AI analysis, backtesting, authentication, and Alpaca paper trading.
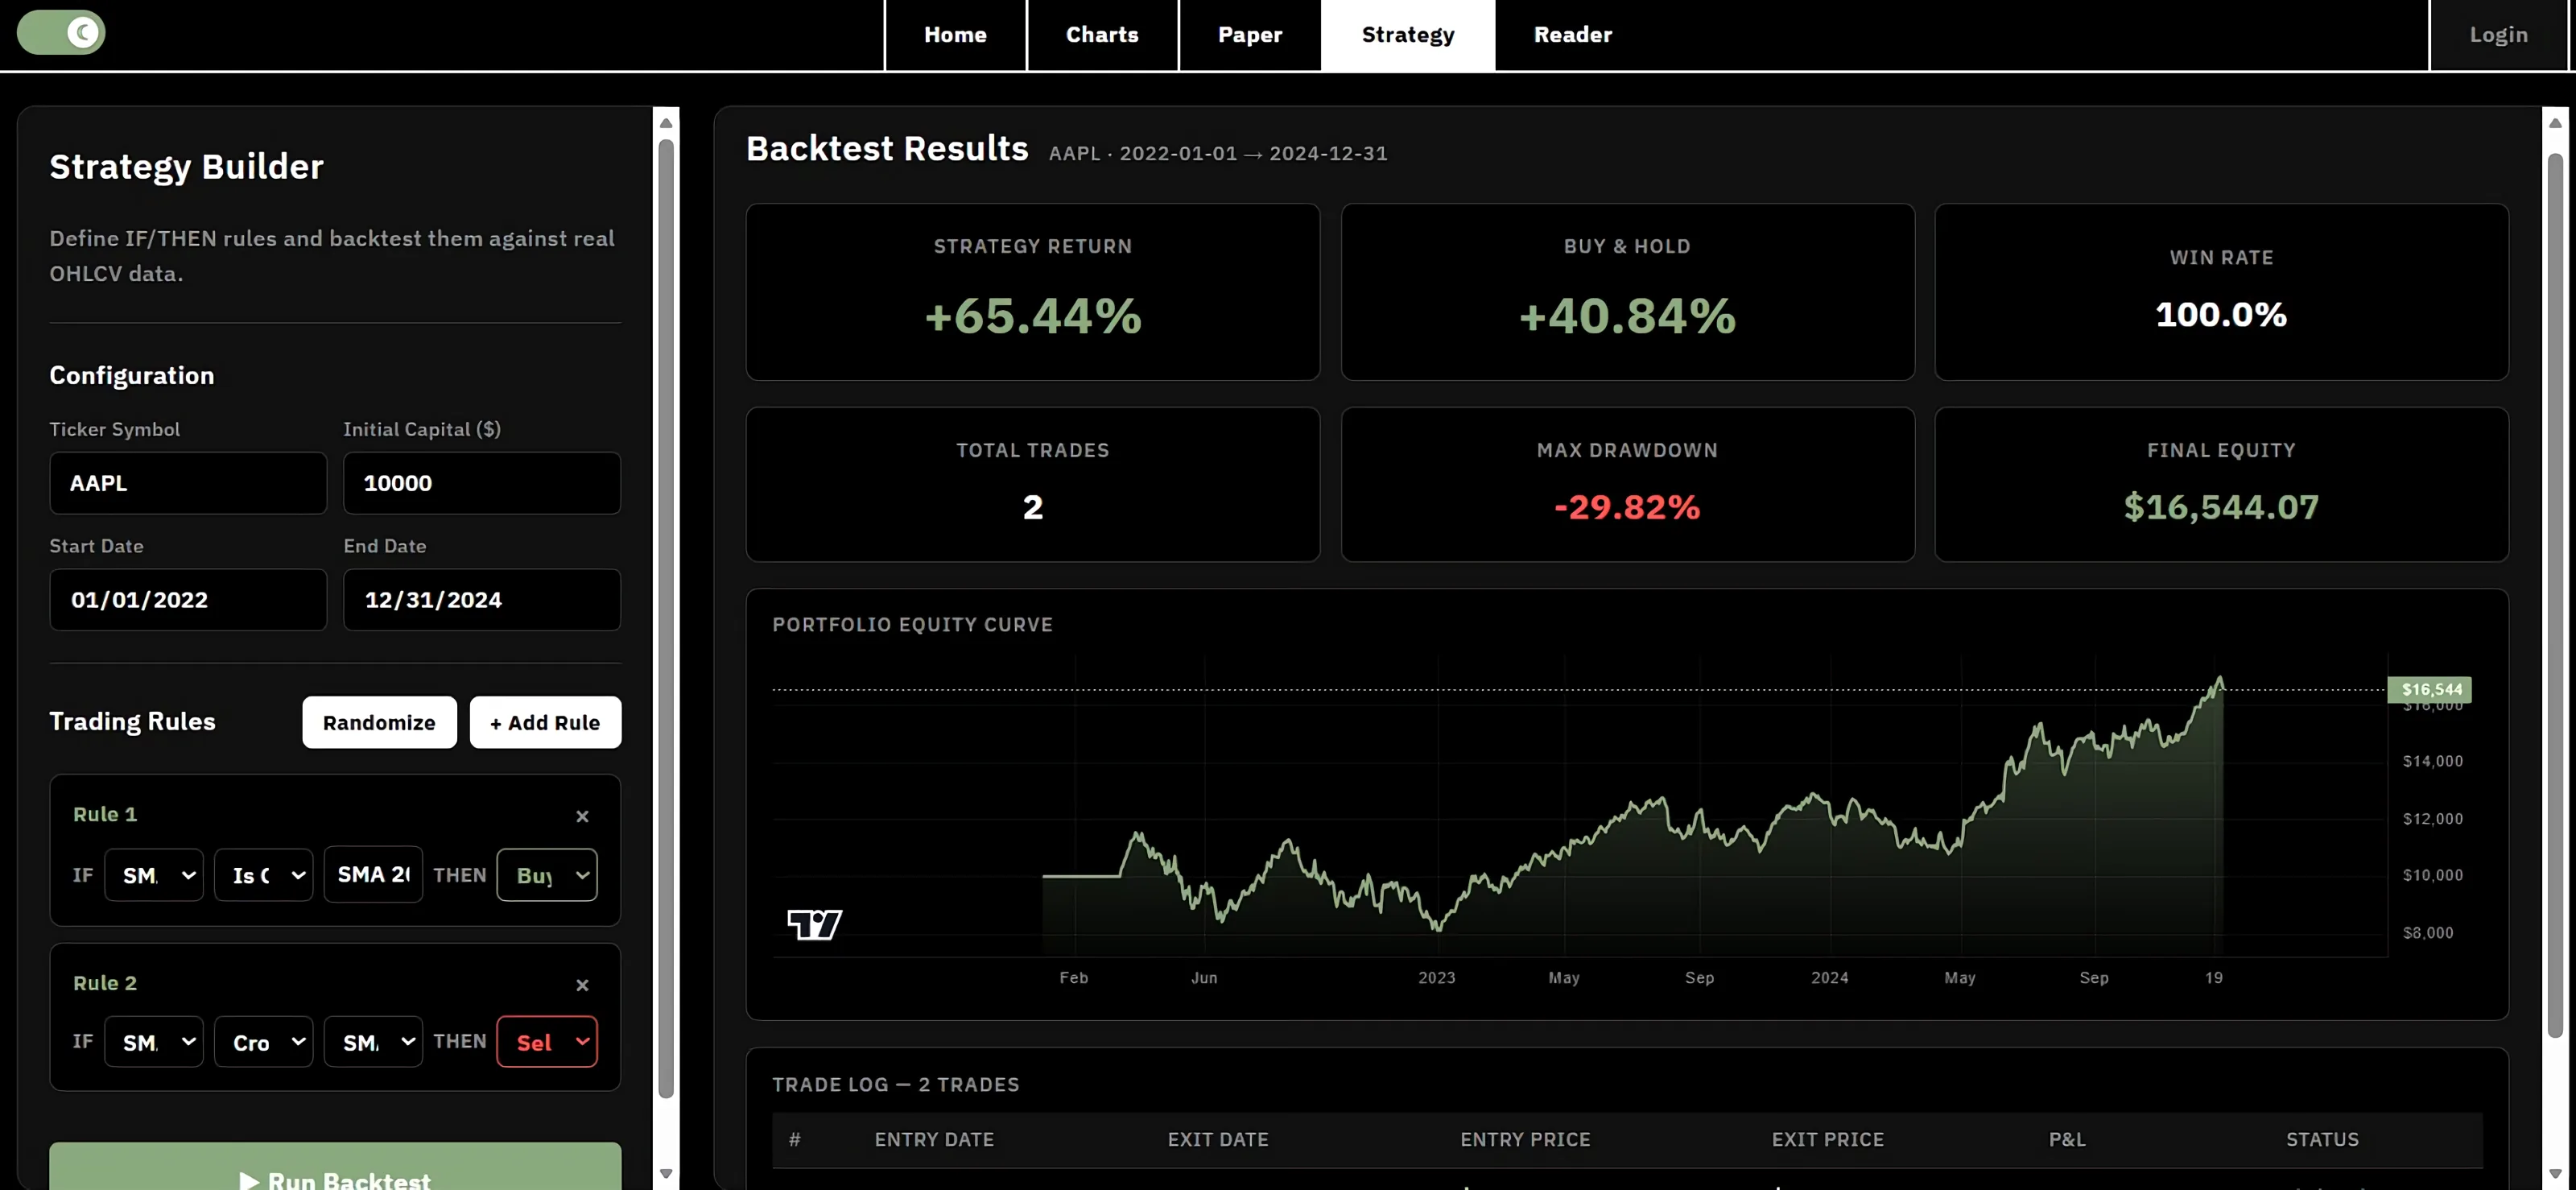
The Strategy tab is a rule-based builder and backtesting interface. Users assemble IF/THEN-style rules over indicators (SMA 20/50/200, EMA 20, RSI 14, MACD, Price) with conditions, comparison values, and actions (Buy, Sell, Close Position, Do Nothing). Submitting a backtest sends ticker, date range, starting capital, and rules to the FastAPI backend, which fetches historical OHLCV data, evaluates the rules in a pure-Python backtesting engine, and returns performance metrics, an equity curve, and a trade log.
The Paper tab connects the analytical work to simulated order execution via Alpaca. The Reader tab provides a structured educational article surface with a table of contents and section-level navigation; the chart workspace can dispatch users directly into relevant reader sections so a beginner can encounter an unfamiliar concept in the live chart and jump to the explanation.
The evidence.

Limits & next.
Limits
- Volume-profile estimate falls back to a local approximation when Alpaca market data is unavailable.
- Rule-based strategy builder currently supports a fixed indicator catalogue (SMA/EMA/RSI/MACD/Price).
Next
- Transition off the free yfinance data path toward institutional-grade market data.
- Let users connect real brokerage accounts so the same interface drives live trading, not just paper trading.
- Expand the asset library and deepen the granularity of the on-demand AI explanations.
- Iterate the predictive models and risk-analysis systems on the technical side.